3D Quake Visualizer
3D Quake Visualizer is an interaction application designed to allow the user to investigate the half million earthquakes that have been recorded around the world since 1973. Users can view this data from multiple perspectives at once, and can take advantage of convenient functions to filter and manipulate the data, in order to understand the relationship between earthquake magnitude, depth, location relative to tectonic plates, and timing. I hope that this application is of interest to both the general public and scientific users.
I have also participated in the creation of an application to explore earthquakes in 2 dimensions. That application can be found here:
https://sites.google.com/site/cs491project2/ .
The Data
This data was obtained from the US Geological Survey's Global Earthquake Search site at http://earthquake.usgs.gov/earthquakes/eqarchives/epic/epic_global.php. Each quake had a recorded magnitude, measured in the Richter Scale, which provides a standardized measure of energy released by a quake. The data also gives the depth of each quake, along with a latitude, longitude and the day, month year and hour the quake was recorded.
Data is available for download in a csv file, with the following format
Year, Month, Day, Time(hhmmss.mm) UTC, Latitude, Longitude, Magnitude, Depth
1973,01,01,034609.80, -9.21, 150.63,5.3, 41
1973,01,01,052229.80,-15.01,-173.96,5.0, 33
1973,01,01,092857.20,-22.16, -65.79,4.8,205
Data was processed to remove quakes that lacked a magnitude, depth, latitude, longitude or date. Out of 620,000 original quakes, over 500,000 were included in this application.
How to Obtain and Run 3D Quake Visualizer
MacOSX users can download 3D Quake Visualizer here. To run it, first unzip the file using Archive Utility, then you go to double click on earthquakeVisualizer3D/earthQuakeVisualizer3D/build/Debug then double click 'qtevents' to run the program. To view or download source code, go here.
How to use 3D Quake Visualizer
Demonstration of this application at my youtube site: http://www.youtube.com/watch?v=wa_xPoF4nBs
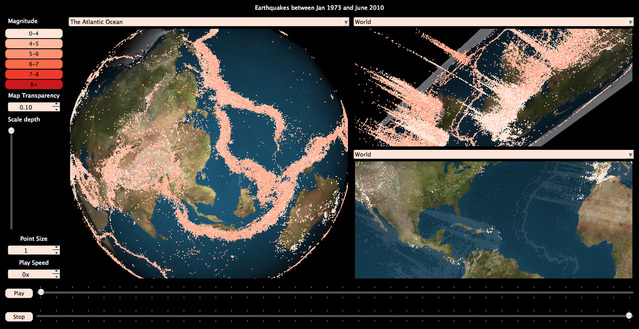
Display:
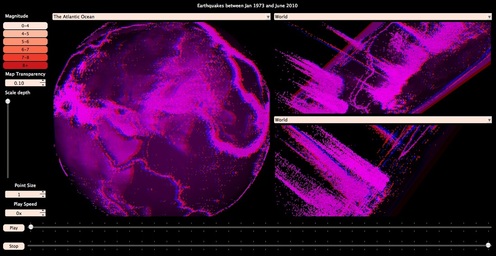
3D quake visualizer opens to a view with 3 render windows displaying quakes on the surface of a 3D globe or on the surface of a plane in 3D space. Each render window holds an object that can be positioned and viewed separately, allowing the user to view the same information from multiple perspectives.
User Interaction with Render Windows
You can zoom toward and away from the globe or plane using mouse scroll or trackpad controls. Simply click the mouse and move to reposition to actor. There are additional controls that provide a finer range of motion in space including 'Command‐mouse drag', which rotates the object and 'Shift‐mouse drag', translates the objected in the direction of mouse movement.
Controls:
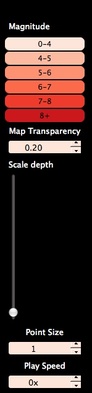
There are a series of controls in the window that allow you to filter and manipulate the data, and the way in which data is displayed.
There are a series of controls in the window that allow you to filter and manipulate the data, and the way in which data is displayed.
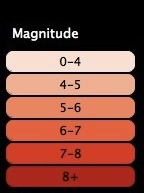
The magnitude selection buttons allow you to add or remove quakes of different magnitudes. Magnitudes that have been removed will be gray-ed out until they are selected again.
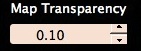
The transparency of the map overlayed on the 2D plane of the world can be controlled by manipulating this button. Ticks up will increase the transparency of the image, until it is no longer visible.
The spherical representation of the world is always opaque, for a clean view.
The spherical representation of the world is always opaque, for a clean view.
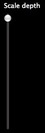
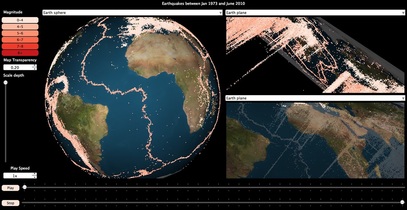
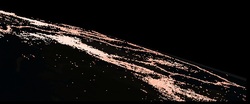
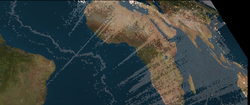
The display is initialized to show depth with accurate scale relative to the scale of the surface of the world. This means that most values appear in line with the surface of the earth. To scale depth so that differences are more evident, drag this slider upwards. Earthquakes will now appear in 3 dimensional space, as can be seen below:
The point size control allows you to resize the points displayed on the screen. Larger points can be used to make points appear more visible when few quakes are displayed on the screen.
The play speed control allows you to control the rate of play-back when in 'Play-Mode."

Quakes can be animated over time by pressing the play button, and stopped by pressing the stop button. In addition, the range of quakes displayed, and the range of quakes over which the program will play, can be controlled by pulling on the slider bars next to the play and stop buttons. Quakes displayed on the surface of the earth are removed or added in response to user input. When the sliders are dragged together and pulled in the constraining direction, one month at a time may be shown. This allows the user to manually play back the quakes.

Above each render window there is a set of locations to which the user can move instantly. These areas are distributed throughout the earth, but concentrated in regions of high quake activity. To return to the starting view, you may simply select 'world' from the window.
Note: There are technical problems with this section of code that prevent sufficiently rapid updating of the scene. If you click in the box and move the mouse around, the scene returns.
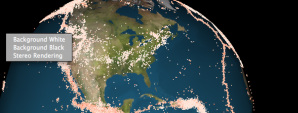
One final control to note is the 'pop-up' menu that emerges when right clicking with a mouse, or tapping with two fingers on a trackpad. This gives the user the option to change the background color, or view the data in stereo (see below).
Stereo
Stereo views are enabled in 3D Quake Visualizer. you will need 3D glasses to view these images in stereo. Individual windows may be set to render in stereo, allowing simultaneous viewing of stereo and non‐stereo images.
What can be seen using 3D Quake Visualizer?
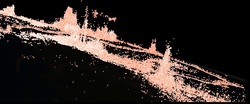
A two dimensional visualization can only convey so much information about a three‐dimensional phenomena, like earthquakes. Two dimension views typically adopt a color scheme to indicate depth, perhaps along with a size or darkness/lightness spectrum for magnitude. It is difficult, however, to see patters within data when many encodings are used to show data attributes. This effect becomes clear when the considering the following images of quake data along the mid‐Atlantic fault.
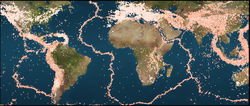
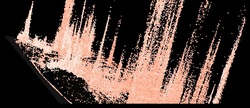
From this view, the fault line is apparent. What is not apparent is that quakes fall into two distinct depth zones. These zones can be best seen in 3D images below:
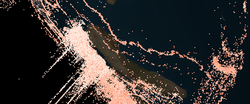

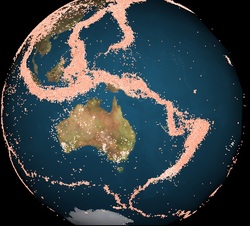
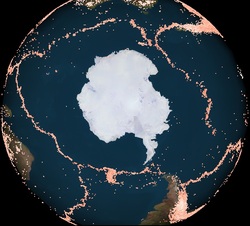
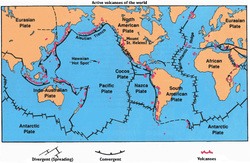
This clear view of merging plates in the central Atlantic is mirrored in other parts of the world.
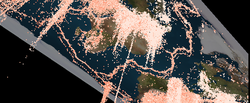
In addition, the view of quakes on a 3Dimensional representation of the world sometimes shows the continuity between regions of the earth, thereby connection tectonic plates, in a way that one dimensional map cannot.
In addition, the view of quakes on a 3Dimensional representation of the world sometimes shows the continuity between regions of the earth, thereby connection tectonic plates, in a way that one dimensional map cannot.